
Software gives clear display of relevant data
20th May 2010
Source:
HBM
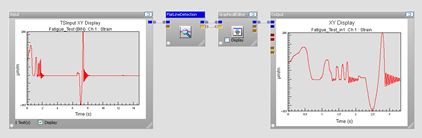
HBM has launched an upgraded version of its powerful nCode GlyphXE™ software that is especially suited for analysis and evaluation of huge amounts of data. The 2.0 version features a completely new software module that automatically corrects irregularities in the measurement data along with a multitude of additional improvements for easier and faster data visualization.
The latest version of nCode GlyphXE™ is very simple to operate thanks to its intuitive graphical user interface. A new option for viewing data directly from the browser makes working with many data files more convenient than before. This function is extremely beneficial when only a quick look at the measurement data is required, for example, to select the desired data set.
Graphical comparison of different measurement data – multiple measurements of the same test, for example – can easily be achieved by displaying the information on layers on top of each other.
Users can automatically correct any irregularities or negative effects in the measurement signals that might interfere with any subsequent analysis. In long-term monitoring, for example, only individual – often infrequent – events are relevant. In between these events, so-called flat lines can occur that expand the data volume and contain only static signal components which are now automatically corrected. In addition, test results may drift because of temperature variations during long-term monitoring. If a drift in a known measured value is detected then the module initiates an automatic reset of the origin to facilitate test value monitoring.
The new add-on module also automatically corrects any irregularities resulting from electromagnetic interference affecting the measurement data in the form of spikes. By automatically correcting irregularities – such as flat lines, drift and spikes – a clear and unambiguous display of relevant data is provided for the user.
Similar articles

More from HBM
- HBM to exhibit weighing technology at PPMA show 2018 27th July 2018
- Measurement module enables torsional vibration analysis 23rd May 2018
- Strain gauges designed for high temperatures up to 350°C 30th April 2018
- Torque sensor enables demanding static and dynamic measurements 6th March 2018


Write a comment
No comments