Altair Releases PBS Analytics 12.0
7th May 2013
Source:
Altair Engineering
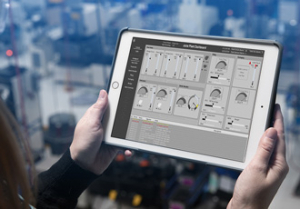
Altair today announced the release of its completely redesigned PBS Analytics 12.0 data analysis and visualization tool for high-performance computing. This substantially advanced version of PBS Analytics has been re-built from the ground up. Inside, it offers a new, high-performance database and more robust data collectors; and outside, it provides a completely new user experience, enabling users to analyze huge volumes of data quickly and easily.
PBS Analytics 12.0, a Web-based tool, has been released in response to a burgeoning demand for more comprehensive analysis of HPC usage. It incorporates a new chart designer that provides users with more flexibility than ever before in creating clean and concise charts. It also offers additional chart options, including XYZ plots, for enhanced visualizations that furnish deeper understanding of the organization's HPC infrastructure and better root-cause analysis. Moreover, PBS Analytics 12.0 users will find out-of-the-box charts for analyzing productivity, efficiency and utilization, becoming instantly productive with the new Web portal, with a minimal learning curve.
Altair has worked closely with customers in the Americas, in Europe, and in Asia to ensure PBS Analytics 12.0 is solving real issues for real users, said Bill Nitzberg, Chief Technology Officer for PBS Works at Altair. With these insights, Altair has developed a brand new tool that delivers lightning-fast performance and scales quickly to support millions of job records.
To provide superior, more insightful data analyses, PBS Analytics 12.0 furnishes new ways to visualize HPC operations track job and resource use, and perform root-cause analyses. Each of these features within PBS Analytics 12.0 is an essential element in gaining a deeper, more accurate understanding of HPC infrastructure for better chargeback and showback accounting, better return-on-investment calculations, and better planning.
PBS Analytics 12.0 also provides new support for utilization charts that show utilization adjusted for configuration of the system, accounting for the addition or deletion of nodes over time. This information can be used to improve overall IT efficiency and justify IT investments by illuminating actual usage and by uncovering usage hot spots, designating where added resources will have the greatest impact, and identifying usage deserts where resources can be replaced.
Dashboards and slideshows
A particularly helpful feature of PBS Analytics 12.0 is its new presentation capabilities: the ability to create dashboards and slideshows. Dashboards are collections of charts that detail such information as trends in cluster usage, individual usage, most popular nodes and other data. Slideshows can include regular charts, dashboards, and even locally created slides and graphics, and cycle through the visualizations in a continuous loop.
These slideshows are especially appropriate for display on large public screens. PBS Analytics 12.0 can stream up-to-date slideshows of HPC metrics to provide highlights and status in operations centers, company boardrooms, or as a showcase in the company headquarters lobby.
PBS Analytics is a trusted tool that we rely on extensively, said Giorgio Giraldi, HPC Systems Administrator at SelexES SpA, and Altair customer. It's highly customizable and easy to use, enabling us to analyze usage of HPC resources so that we can plan and correctly identify new business opportunities.
PBS Analytics 12.0 users need only a Web browser, a set of Web services and one or more data collectors to transfer data to the PBS Analytics database. To begin using PBS Analytics 12.0, contact your Altair account manager.
Similar articles
More from Altair Engineering
- Altair Feko WinProp to be exhibited at EuCAP 2019 in Krakow 20th March 2019
- Design poised to transform product development 11th September 2018
- 2018 Global Altair Technology Conference keynotes announced 23rd July 2018
- Flow simulator software for engine system modelling 18th July 2018


 technology at Jacobs Vehicle Systems.JPG)


Write a comment
No comments